
|
I spend a lot of time with startups. Mainly in Scotland. Where we our unique history binds a country on the fringe of the world deep into global innovation. We are proud of our two unicorns. And there are some amazing founders and businesses. Its tough to generalise - I met Alba Orbital who make satellites this week for example. But the most common business model is a subscription SaaS company aimed at SMB customers. That’s why I write about this stuff so often.
And it niggles a bit that a lot of SaaS analysts focus on the challenges of the SMB market. Every other week I read an article somewhere that argues that you must target the enterprise to achieve SaaS growth. Most of these posts are written by people smarter than me. Yet I can’t get away from a sense that they are missing something. That the economics of SaaS for SMB work. In a niche for sure. But also at scale. I have one fundamental and rational reason for this. SMBs are a huge market. As this Edinburgh Group report shows they contribute 51% of the economy in the developed world and 67% of employment globally . This week I found time to do some digging into the real economics of the businesses that might serve that market opportunity. Here is my thinking on how the unit economics of SMB SaaS could support a great company. Maybe even a few more of those one horned white horses. What do the base numbers for SMB SaaS look like?
As a starting point we need to pick some numbers to model the unit economics. These are averages or benchmarks. Not because you should aim for them. Just to give a representative idea of how a “typical” SaaS business works. The base levels for the analysis below came from:
I have summarised these assumptions in the table below. Showing the high, medium and low (HML) points for each assumption. 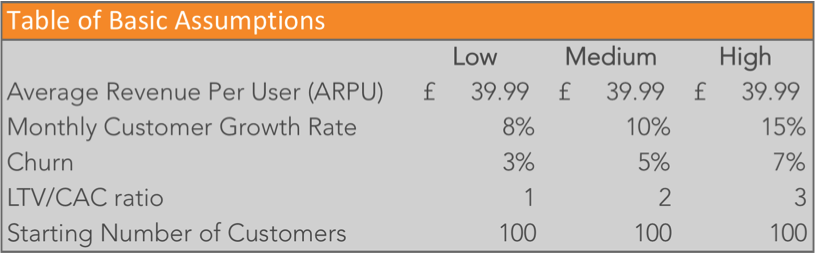
What follows is a whole lot of messing around with these numbers. If you don’t have the time or the appetite to follow this take away just these messages:
Analysis 1: Growth rates
Now let’s start looking at the impact of different trends in some of these basics of unit economics. I will start with the simplest variable which is growth rates. The graph below shows the impact of H (15%), M(10%) and L(8%) growth on monthly recurring revenue (MRR) and free cash flow (FCF). I have used revenue not gross margin. For small SaaS companies storage and processing costs are in effect fixed cost. Not variable with revenue. As you grow you should switch to gross margin for this type of analysis.
FCF is defined as the difference between the cash paid by customers and the CAC spent each month to acquire new customers. In this simple example cash paid and MRR are identical. Because I have assumed all customers pay monthly. We will examine the impact of upfront annual subscriptions later. The other main assumptions are constant across all the HML variables. Churn is 5% in each case, LTV/ CAC ratio is 3. ARPU at £39.99 and opening customer base of 100 are the same for all graphs. 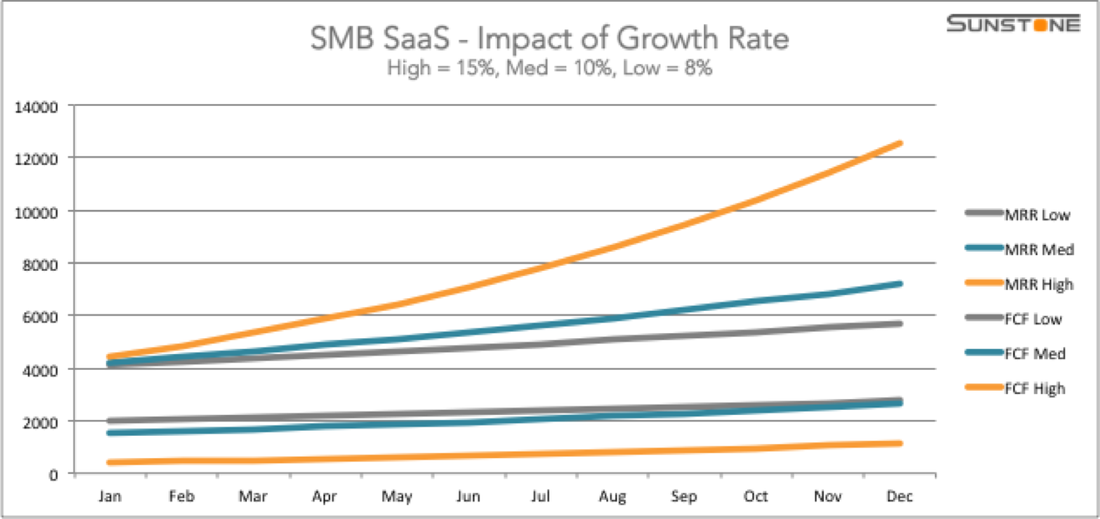
This tells us two things. No surprise that the higher your growth rate, the faster MRR increases. By the end of just one year you can see that the High growth option is pulling away from the others fast. If you play with the numbers you find that 15% is around the minimum for the start of a hockey stick to occur within a year.
FCF works the other way around. Faster growth needs more cash to keep the users flowing in. This would change if the LTV:CAC ratio was better for higher growth instead of fixed at 3. This is an important lesson. High growth can arise either from a more efficient sales model or spending more money. If you are struggling to match the cash raised by your competition, the only answer is to be smarter. And the LTV:CAC ratio is the key metric to track. Analysis 2: Churn
What about churn? Lots of analysts think this is a key factor in SaaS success. Lets fix the growth rate at 15% just so we get a little hockey stick at the end. The graph below shows MRR at H (7%), M (5%) and L (3%) churn.
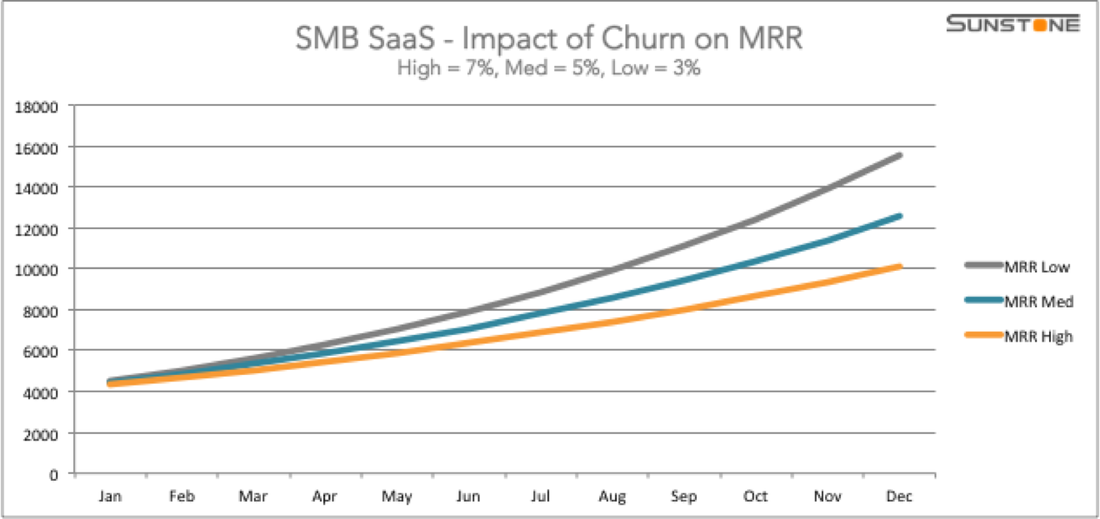
Here we see a spread of outcome which pretty much follows the spread of churn. Losing customers matters pretty much in proportion to the rate of loss. Keep an eye on churn but don’t get it out of proportion.
One important caveat. I have used churn in customer numbers here. In a SaaS company where the range of ARPU is quite narrow this makes no difference. But if your highest paying customers represent a significant portion of your revenue then MRR churn matters more. The bigger your customers the higher the likelihood that this will be the case. This will also have a big impact on your sales model. Upsell to existing customers is much more important with an enterprise customer base. Before we leave churn let’s take a look at another effect. If we use the same HML for churn and the same 15% growth rate and fix the LTV:CAC ratio at 3, look what happens to FCF. 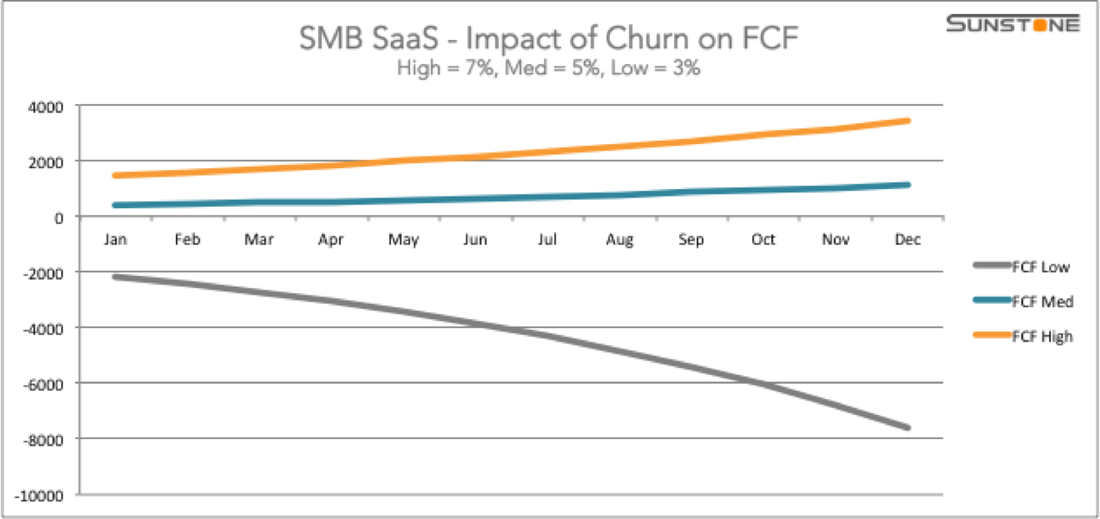
Wow! That looks totally wrong. Cash flow gets worse the better churn gets? This is where a small understanding of the dynamics of metrics and ratios could save you a lot of money. Churn is used to calculate LTV. The normal formula is just ARPU/ Churn % = LTV. As a result lower churn gives higher LTV. If we fix the LTV:CAC ratio then higher LTV is an automatic translation into higher CAC .
Simple lesson. LTV:CAC ratio matters but so does the absolute value of CAC. If I fixed the value of CAC instead of the ratio we would see the same pattern for FCF as for MRR. Reducing churn is a good thing. But don’t allow your CAC to drift up at the some time by focusing only on the ratio. Analysis 3: LTV:CAC Ratio
Let’s take a look at that ratio. The 3:1 target is rough and ready. Anyone I have read recommends it and then add that there is no rationale behind the number. What impact does it have if we start changing the ratio?
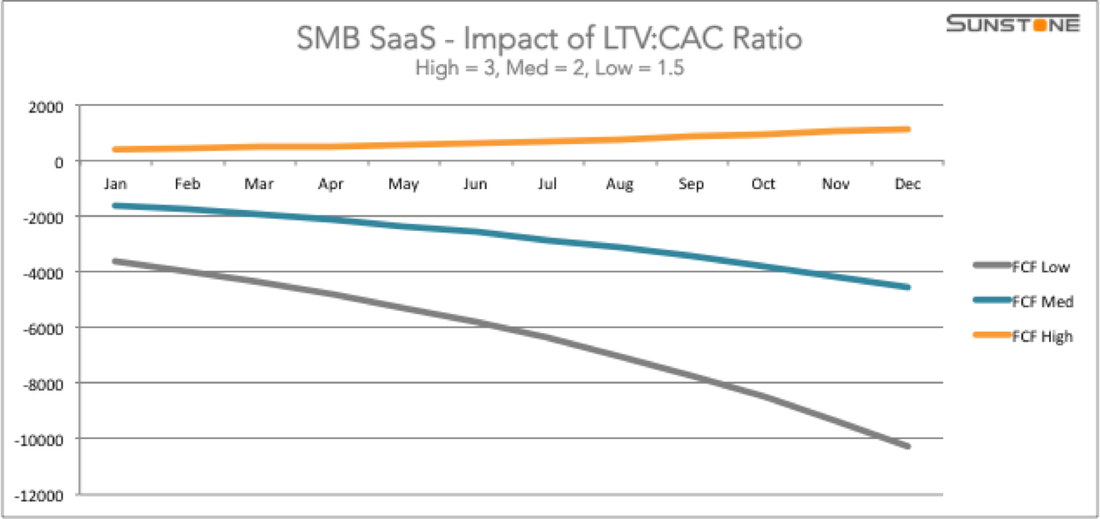
This only affects FCF. MRR does not vary with the LTV:CAC ratio. I have stuck with the 15% growth rate for all 3 scenarios because this is cash hungry. Churn is fixed at the median of 5%. I also see no point in modelling a ratio of 1:1. In this case by definition you are never making any money so something has to change.
It turns out that 3:1 is right on the button. Below this level (1.5:1 or 2:1) cash burns fast. At 3:1 you can stay FCF positive - just. For your SMB SaaS ever to get to cash positive, 3:1 is the minimum ratio. Get there and keep improving is critical to a sustainable business. Analysis 4: Beware the discount factor
One final analysis of dynamics. Everything so far has been based on monthly subscribers paying every month. Most online SaaS offers packages to tempt payment in advance. Usual approach is a discount for paying a whole year upfront. The argument is that this boosts cash flow. How does this work out in practice?
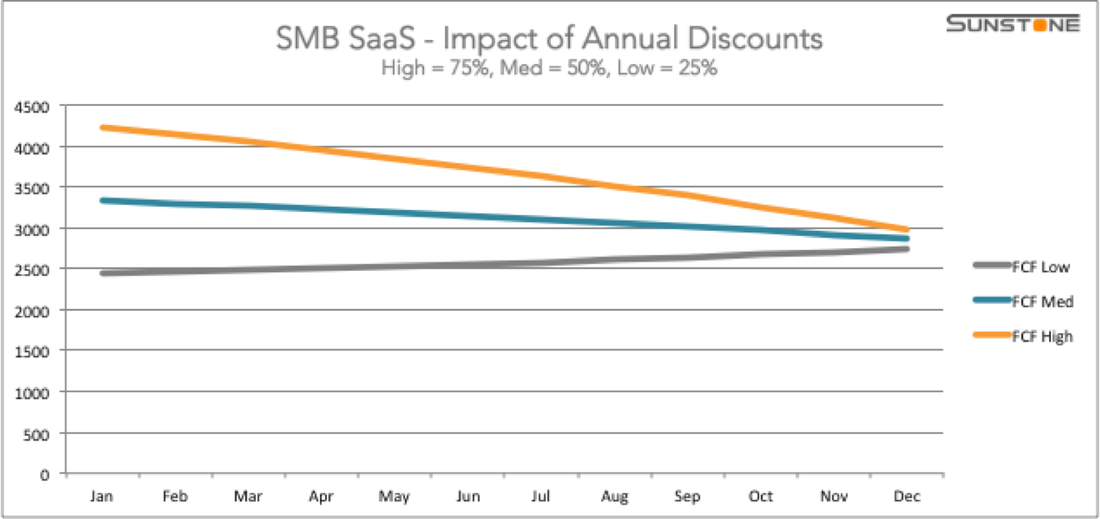
Another sobering picture. I have fixed the other elements as usual but based on 10% growth. The pattern for 15% growth is the same but extends out over 2-3 years - this allows us to see the effect in 12 months.
The discount element is also fixed. I have assumed 10 months for the price of 12. Again a common approach. The most frequent in the sample of companies I looked at. HML here is about the percentage of new customers paying annual upfront - H (75%), M(50%) and L(25%). The higher percentage gives a big boost upfront. But it narrows fast. MRR shrinks the more you discount. If I laid MRR onto this it would show that MRR in the High scenario was 8% lower than in the Low option. Discounts are for the short term. They can produce a much needed cash boost. But keep your eyes open. The benefit is short and the bar for revenue gets higher with every giveaway. How big does SMB SaaS need to be?
The conclusion so far is simple. The unit economics of SaaS for SMB work. You can generate revenue and cash flow provided your CAC is under control. Yet these numbers deal only with free cash flow. You need to build and maintain a product. Proceed customer service and support. Do all the boring admin stuff that you need to run a business. And make a living for the founders. If each customer is small maybe you need a huge number to make a decent business?
The table below shows monthly and annual figures for 100, 500 and 1,000 customers. Using the mid point numbers for all the other operational metrics. 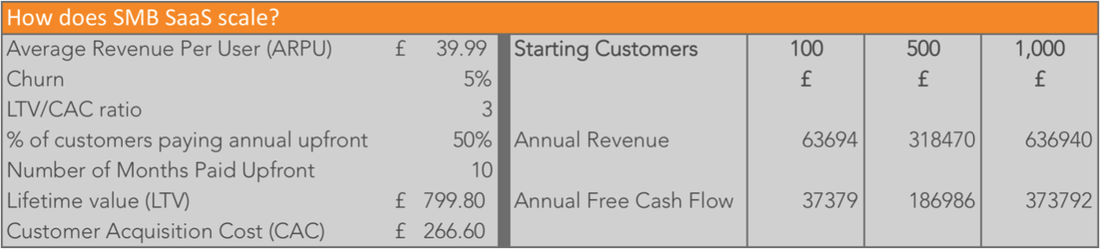
None of these are unicorn numbers. On the other hand in the context of SMB SaaS they are achievable. Even here in Scotland official statistics show that there are 359 thousand SMBs. Scaling further is great. This show that even 500 customers generates enough cash to make a real living.
To make this work you would need to find the funding to get you to 500. And manage your monthly cash burn within these margins. But it is possible. Working in the real world
These analyses are based on averages. There is no such thing as an average business. Every SaaS will be different. Even the “choice” between SMB and Enterprise is not real. Potential customers occupy a continuum. These rough and ready calculations can help guide you. And provide a bit of fun. They are no substitute for paying attention to the real details of your company.
I have put the assumptions and calculations I used to generate these numbers into a free Google sheet. You can access this and play with the numbers for your business if you like. Remember this is a simple sheet so you can produce strange effects like the one in Analysis 2 above. And even if your numbers look good you still need to make stuff happen. In the end metrics are just the voice of your business. What they say will depend on the specifics - customers, product, business model. What you do will depend on you listening and acting on what you hear. These figures are only indicators of the possible. Having worked through them I am convinced of three things:
For anyone involved in building SMB SaaS, don’t be distracted or discouraged. The business model works. Its success depends on delighting your customers so stop reading and get on with it.
Comments
|
Categories
All
AuthorKenny Fraser is the Director of Sunstone Communication and a personal investor in startups. 
Archives
September 2020
|
 RSS Feed
Learn more |
Contact |
©Sunstone Communication Ltd 2016